STUDY OF SUNTRACKER LIGHTING SYSTEM INSTALLATION AT CENTRAL WAREHOUSE– GROCERY

Coordinates: Lon. 23ο44’0″ / Lat 37ο44’0″/ Alt. 10,25μ
CLIMATIC DATA OF THE AREA
In general, the climate has the characteristic of the Mediterranean one, namely, mild and rainy winters, relatively hot and dry summers and great sunshine almost throughout the year.
Mean annual sun radiation: Athens 1.569 kWh/m2 (Source:EMY)


Source: European Commission, Joint Research Centre
Institute for Environment and Sustainability
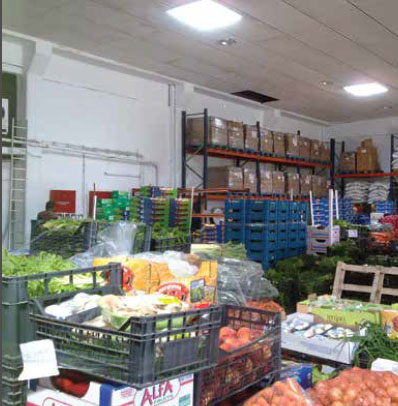
DESCRIPTION OF THE EXISTING SITUATION
VIEWS OF THE WAREHOUSE


Technical characteristics of the existing lighting situation
In this particular installation, the following data apply
Recording of lighting
- Bells : 30×400 watt 12.000 watt or 12KW
- Warehouse operation hours : 12h/day in average
- Days of operation : 322 days/year
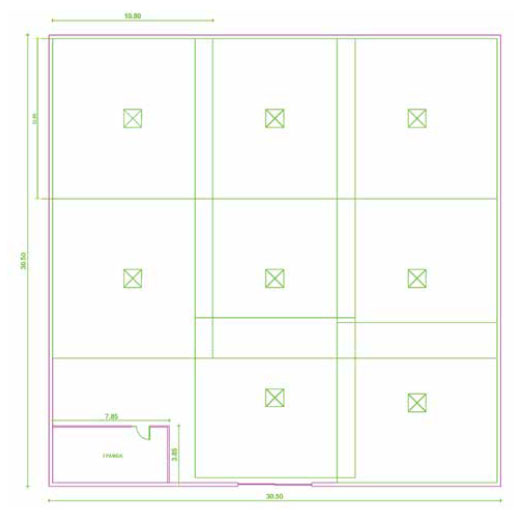
View with the Suntracker systems (exact location)
On the basis of the requirements for this particular installation, the following choice to place the natural daylight Suntracker systems was made. 8 Suntracker system were installed. The choice was made on the basis that product sorting takes place under these particular points. The only point where no Suntracker was installed was the one under which there was a desk

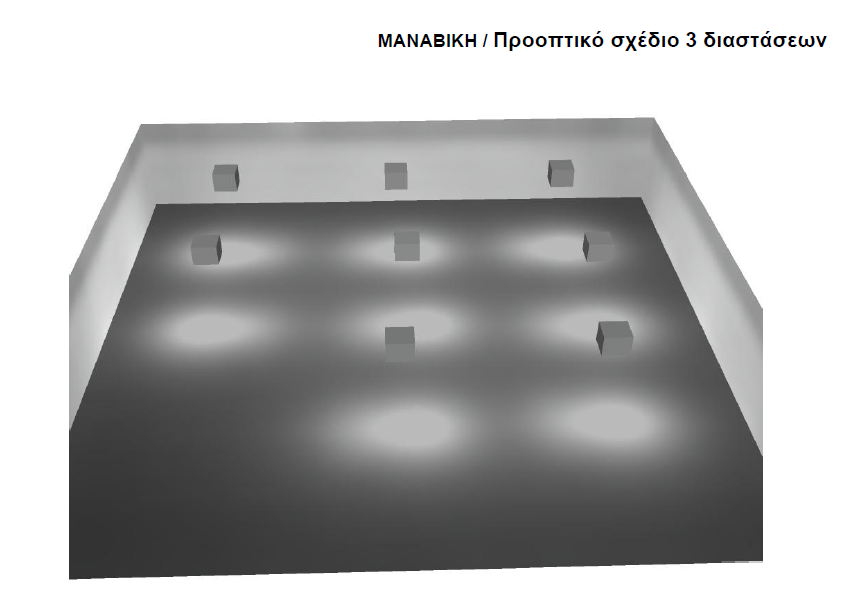
Tridimensional imaging
Here bellow, we can see the 3-D image of the 8 installed Suntracker systems and the respective brightness they emit in the area. Depending on the requirements of the facility, we can chose the points of placement of the Sunrackers. Adequate testing allows us to achieve the desired result.
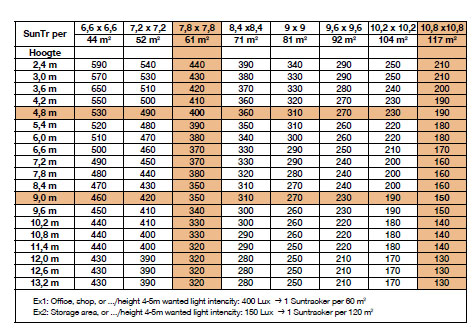
Tabular Presentation of Photometric Data of Luminaires- The light intensity and the luminance are also presented in tabular form


Summary of results
Here bellow we can see the summary view of the facility with the following basic elements being marked:
- Lux achievement around the Suntracker systems
- Installation data (dimensions and height of the ceiling)
- ρ% = reflection rate
- Εm = mean value of brightness in lux
- Εmin = min value of brightness in lux
- Εmax = max value of brightness in lux
What needs to be noted is that the mean value of brightness in lux at the work level is 400lux.
